Phase Transitions and Phase Separation in Manganites
1. Direct imaging of nanoscale phase separation using scanning electron nanodiffraction (PRL 103, 097202 (2009))

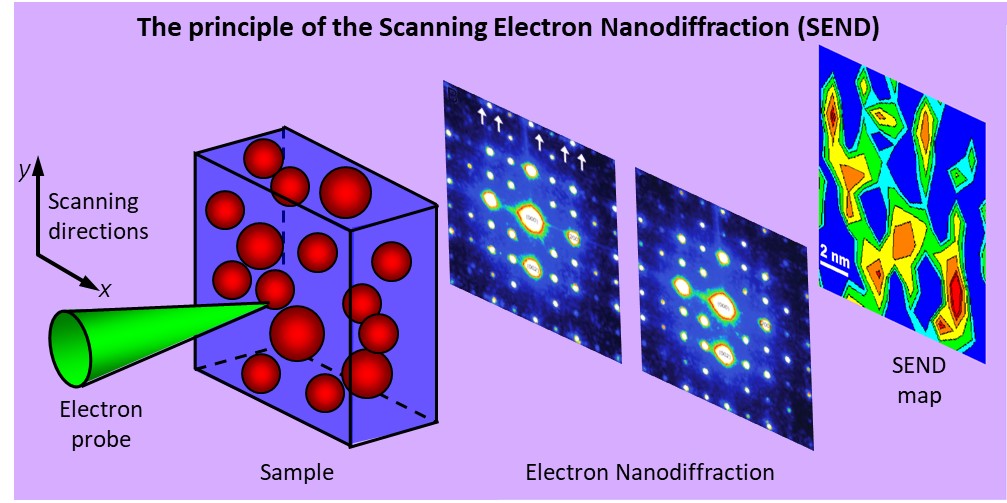
An electron probe in a transmission electron microscope is scanning on the phase separated sample. At every point, an electron nanodiffraction (END) pattern is acquired. Only when the electron probe is located on the charge-ordered (CO) phase do superlattice reflections appear in the END pattern, which allows us to map the real space distribution of the nanoscale CO phase.

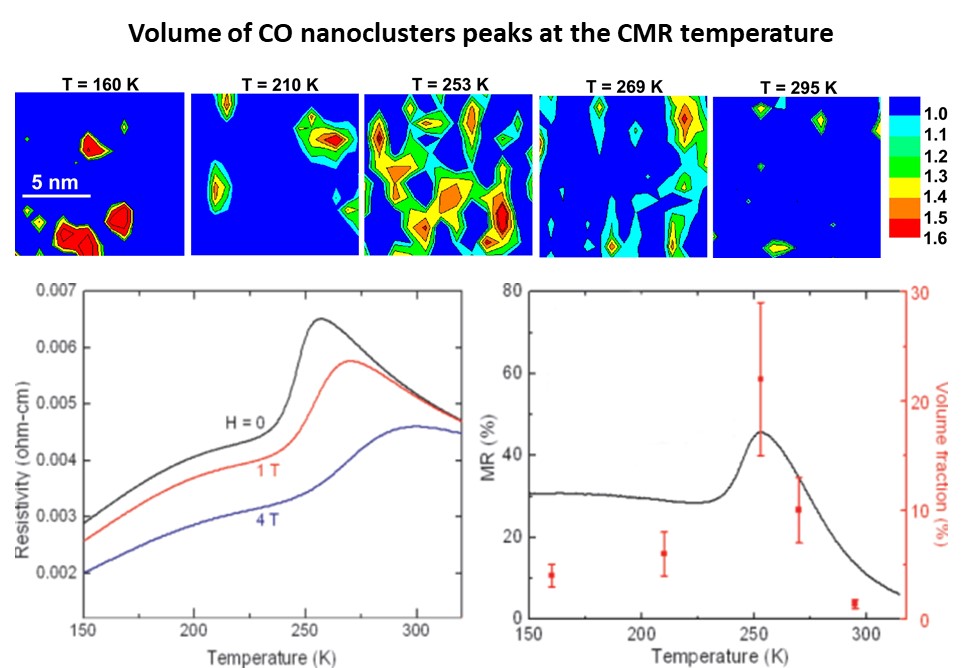
Upper: SEND maps show the temperature evolution of nanoscale CO phase in La0.55Ca0.45MnO3, with warm color corresponding to the nanoscale CO phase. Lower: Resistivity versus temperature under different magnetic fields; The magnetoresistance is compared with the volume fraction of the CO nanoclusters estimated from the SEND maps.
highlighted on Physics Today, Nov. issue, p20-23; highlighted on Parity (in Japanese)
2. The role of structurally and magnetically modified nanoclusters in colossal magnetoresistance (PNAS 108, 20941 (2011))

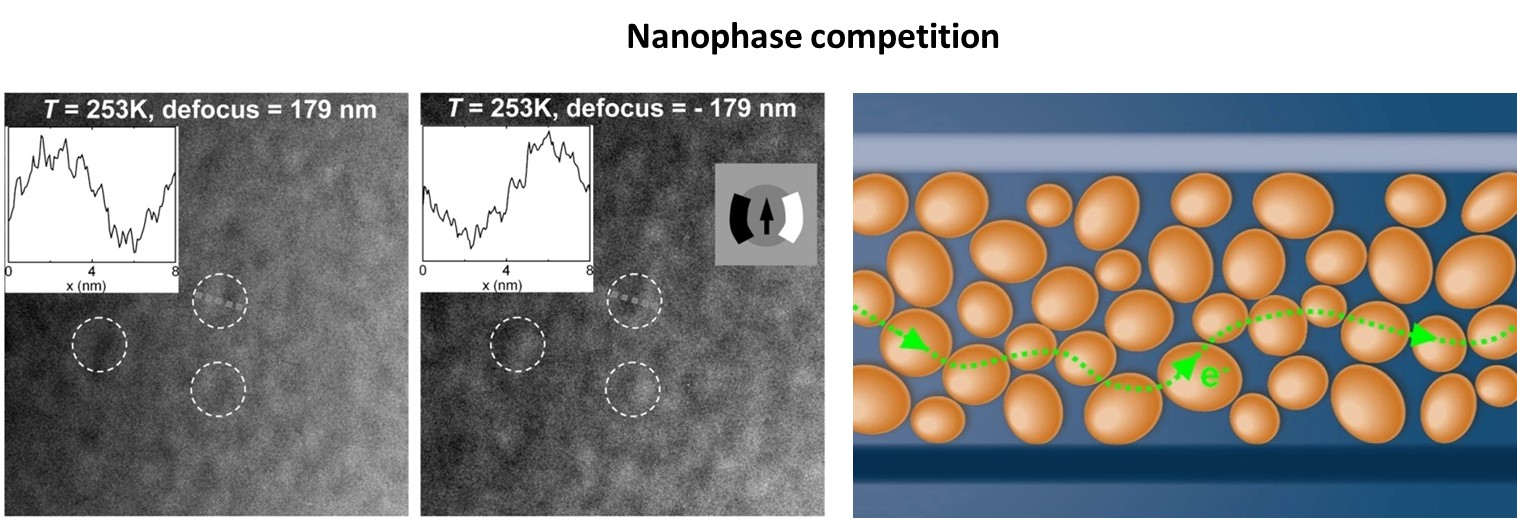
Left: Lorentz imaging of the nanoclusters marked in circles showing contrast reversal under positive and negative defocus imaging condition suggests they are ferromagnetic. Right: Results from La1-xCaxMnO3(0.3 < x < 0.5) all coherently support the CMR mechanism that the resistivity drop results from the electron path formed by the percolation of the ferromagnetic and metallic nanoclusters.
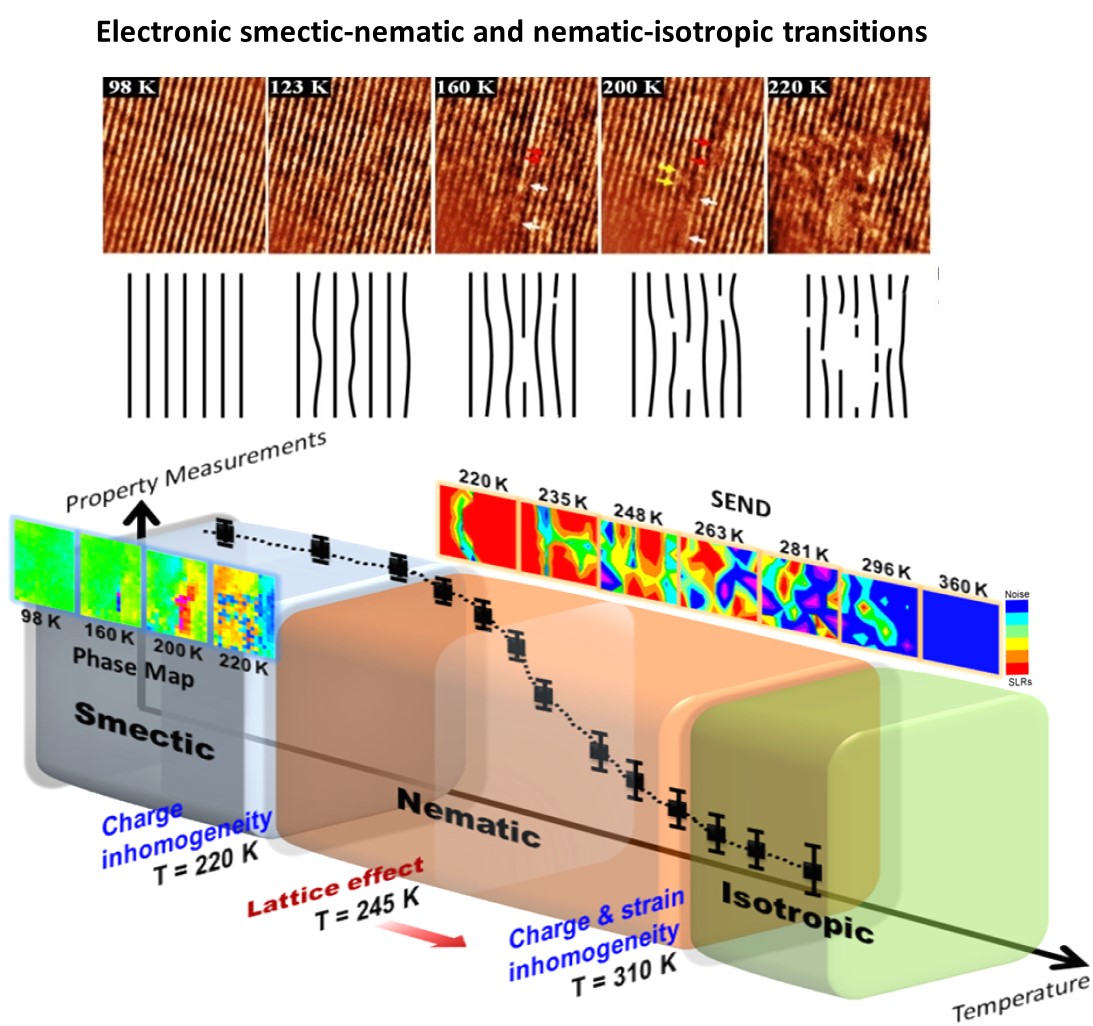
3. Direct observation of electronic-liquid-crystal phase transitions in La1/3Ca2/3MnO3
(Sci. Rep. 6, 37624 (2016); PRB 95, 235113 (2017))
