Educational Experience
Work Experience
|
ProfileWelcome to Microcavity Research Group in USTCMicro/Nano Photonics LabWelcome to microcavity research group at Key Lab of Quantum Information in University of Science and Technology of China (USTC). This group was established in Jun. 2013. Research in this group is centered around ultra-high-Q optical microresonators, including both theory and experiment. These microresonators support whispering gallery modes (WGMs), offer long photon storage times and open a myriad of lab-on-chip applications ranging from fundamental physics to various applications, such as cavity optomechanics, frequency comb, cavity QED, as well as quantum information processing. 本实验小组热烈欢迎感兴趣的博士、博士后、访问学者加盟! 1) Frequency Comb
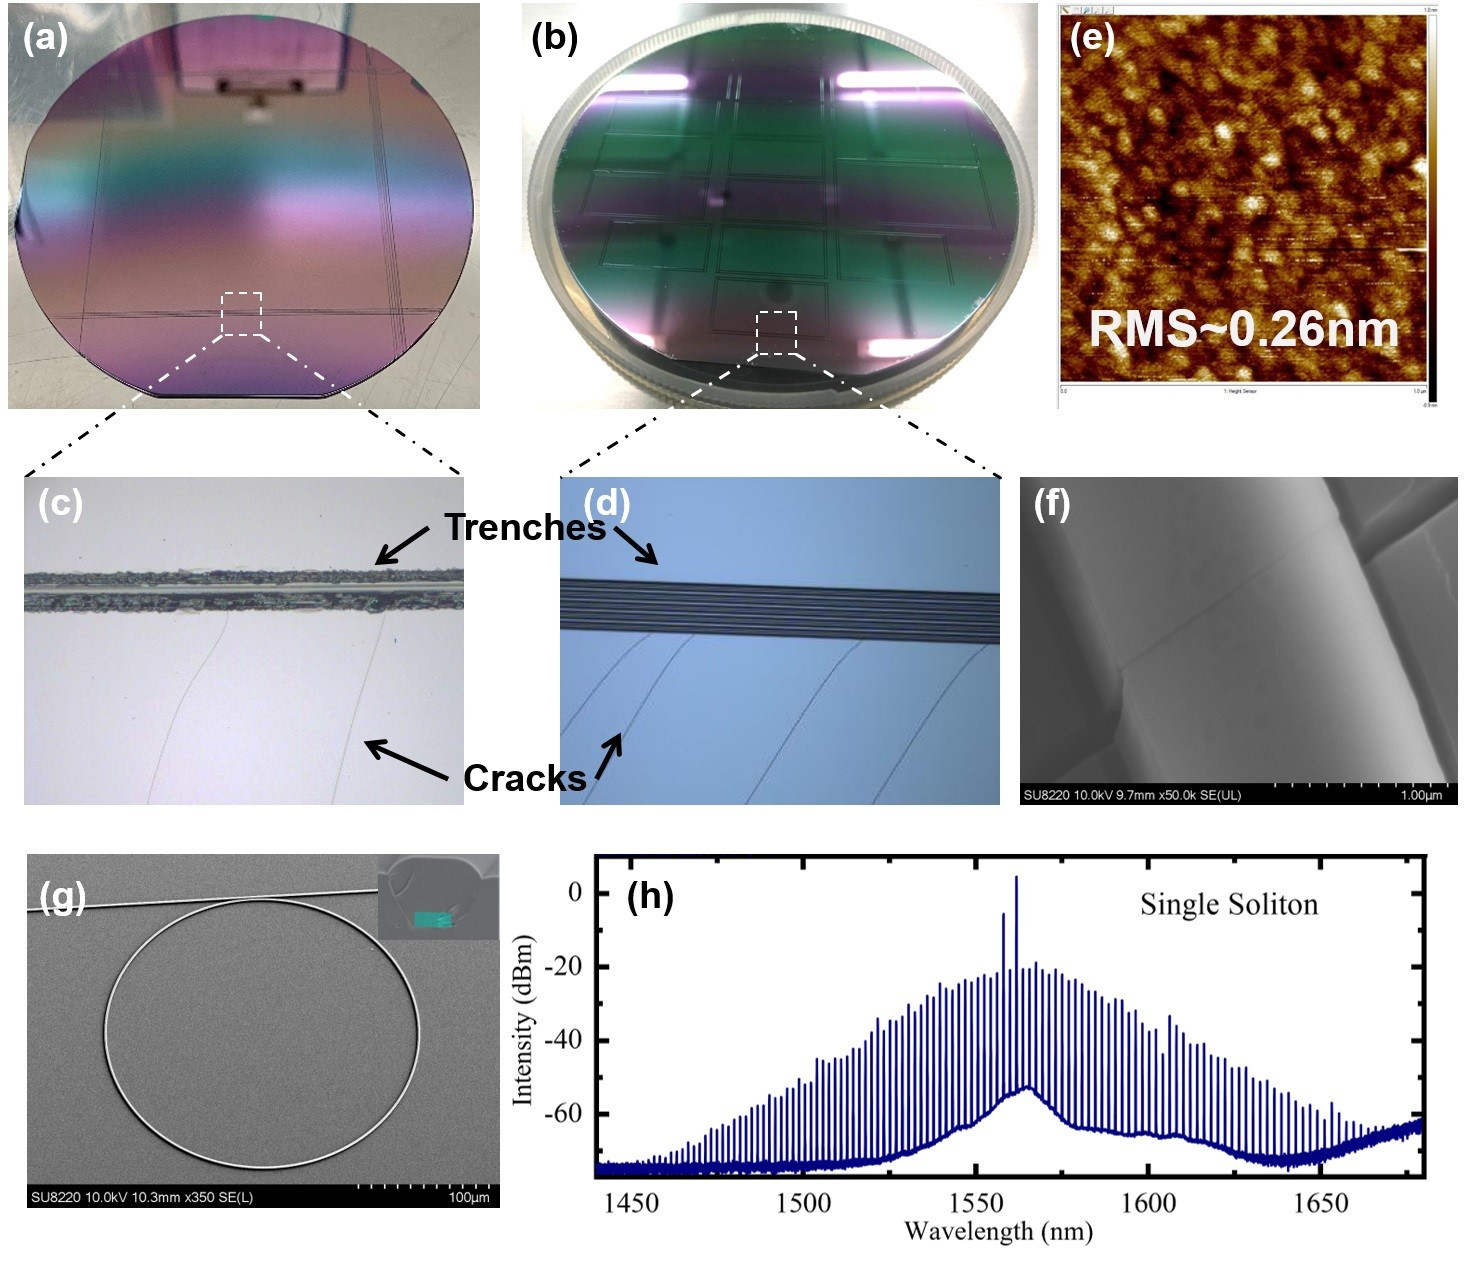
Fig. 1. (a) Using diamond scriber on the 4-inch wafer to draw a square area. (b) Using lithography todefine the patterns of trenches. (c-d) The relevant partial magnifications show that thecracks are successfully blocked by the trenches. (e) The surface range of 1um×1um isscanned by atomic force microscopy (AFM), and the corresponding root-mean-square (RMS) roughness is 0.26nm. (f) Scanning electron microscope (SEM) image of a crack passing through the etched waveguide. (g) SEM image of the Si3N4 microring resonator and bus waveguide. (h) The optical spectra of single soliton state in the Si3N4 microring.
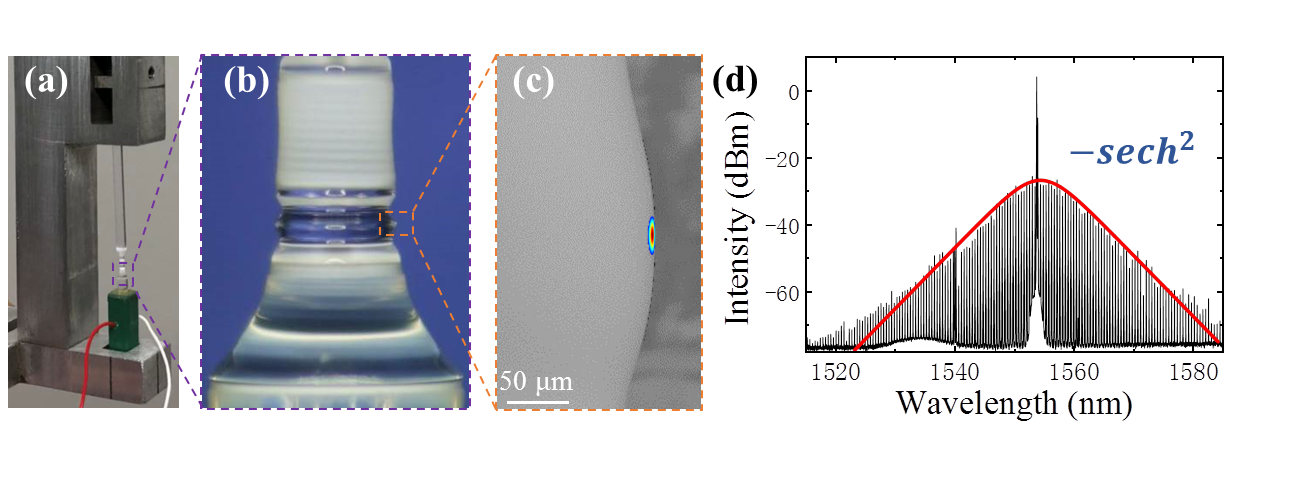
Fig. 2. (a) The setup for the mechanical tuning of microrod, where a PZT (green block) is used to compress the microrod. (b) The photo of the microrod cavity, with a diameter of about 1.2mm. (c) The optical microscopy picture of microrod cavity and the corresponding optical mode profile of the whispering gallery modes by numerical simulation. (d) Typical Optical spectrum of single dissipative Kerr soliton (DKS), the red line shows the spectral sech2 envelope. 2) Optomechanical crystals
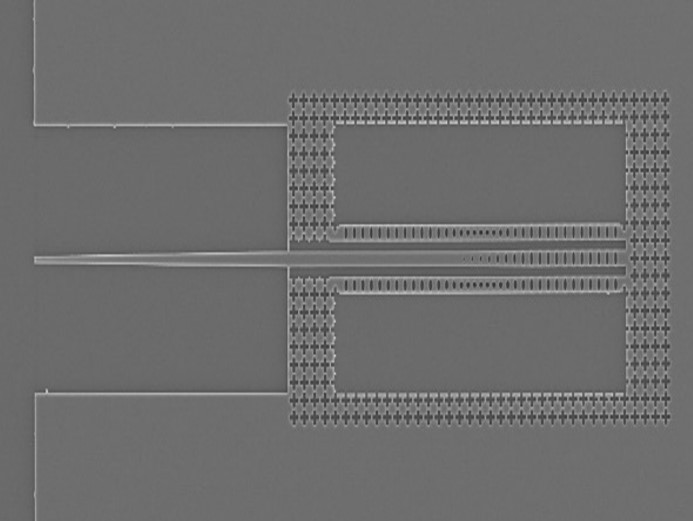
Fig. 3. Scanning electron microscope (SEM) image of a full nanobeam optomechanical crystal (OMC) device. 3) Optomechanically induced non-reciprocity (Nature Photonics (2016), Nature Communications (2018))
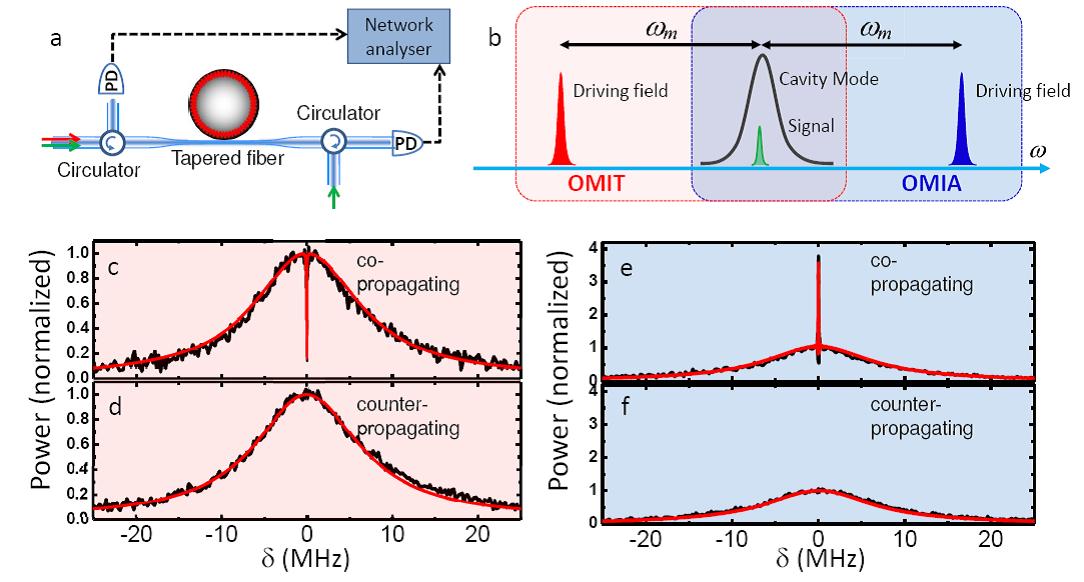
Fig. 4. Optomechanically induced transparency (OMIT) and amplification (OMIA). a, A strong driving field enhances the optomechanical coupling between a mechanical mode and the copropagating optical mode inside a microcavity. b, Spectral position of the driving and signal field in OMIT and OMIA processes. c-d, The emission power spectra in the OMIT response are obtained using a co- and counter-propagating signal pulse. e-f, The emission power spectra in the OMIA response are obtained using a co- and counter-propagating signal pulse. 4) Brillouin scattering induced transparency and non-reciprocal light storage (Nature Communications 6, 6193 (2015))
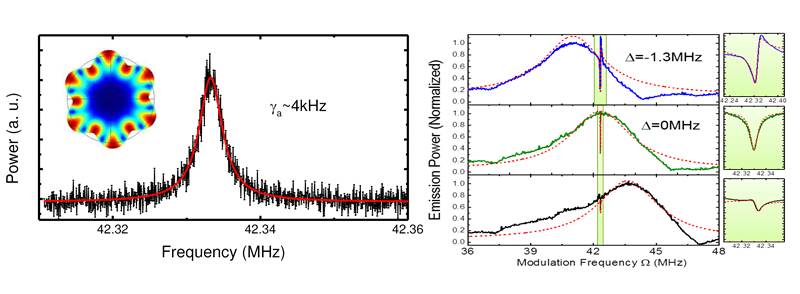
Fig. 5. (A)The experimental data reveal the typical mechanical mode at 42.3 MHz in the microsphere. (B)Brillouin scattering induced transparency were experimentally observed when the probe frequency was scanned by sweeping the phase-modulator frequency for several values of control-beam detuning. 5) Optomechanical dark mode (Science 338, 1609 (2012))
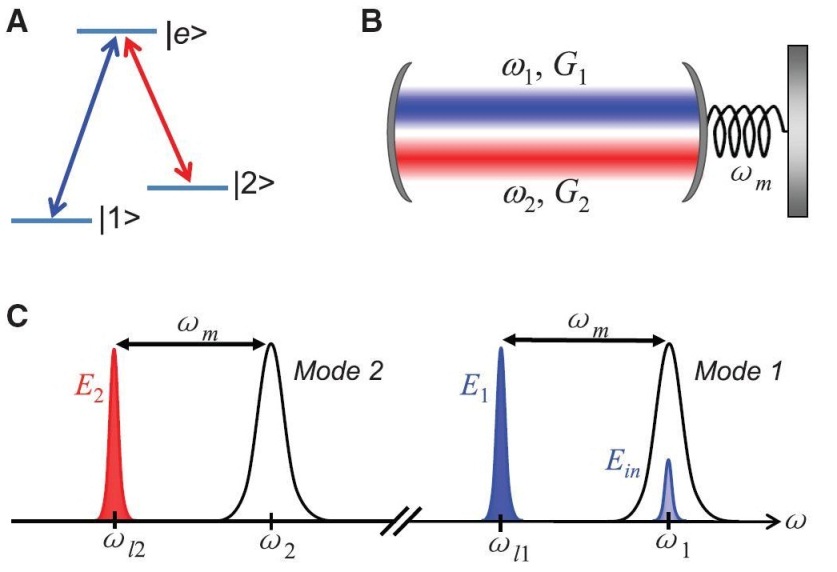
Fig. 6. Concept of the experiment. (A) A L-type three-level system that can lead to the formation of a dark state. (B) An optomechanical system in which two optical modes couple to a mechanical oscillator via radiation pressure, with respective optomechanical coupling rates G1 and G2. (C) Two optical fields, E1 and E2, at the red side band of the respective optical resonance drive the respective optomechanical coupling.
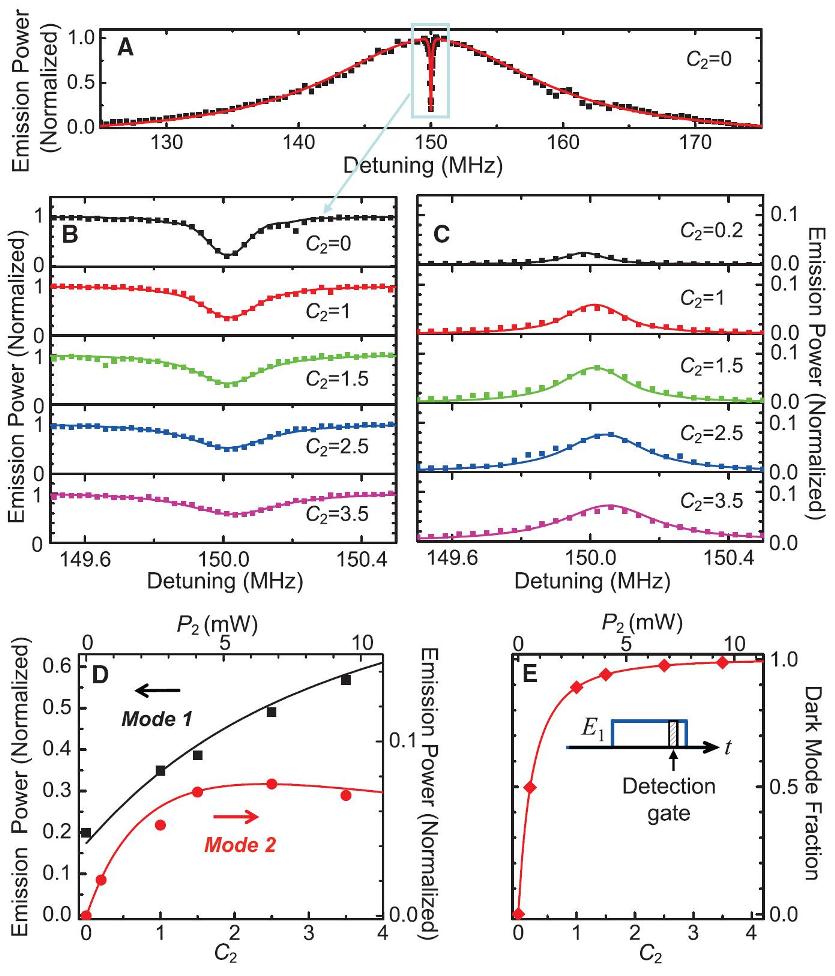
Fig. 7. Excitation of the dark mode. (A and B) Optical emission from mode 1 as a function of detuning, D = win - wl1, with C1 = 1.4 (P1 = 2.5mW) and Pin = 10 mW. The emission power is normalized to that obtained at the cavity resonance with C1 = C2 = 0. (C) Optical emission from mode 2 as a function of D with C1 = 1.4 and Pin = 20 mW. Care was taken in normalizing the emission power to the input signal power. (D) Emission powers from mode 1 (squares) andmode 2 (circles) at D = wm as a function of C2, derived from (B) and (C). Solid lines in (A) to (D) are the theoretical calculations discussed in the text. (E) Calculated dark-mode fraction. The diamonds correspond to the experimental results shown in (D). (Inset) The timing of the detection gate used for the experiment. Pin, P1, and P2 are incident optical powers for Ein, E1, and E2, respectively. 6) Optomechanical light storage & Transient optomechanically induced transparency in a silica microsphere (Phys. Rev. A 87, 055802 (2013))
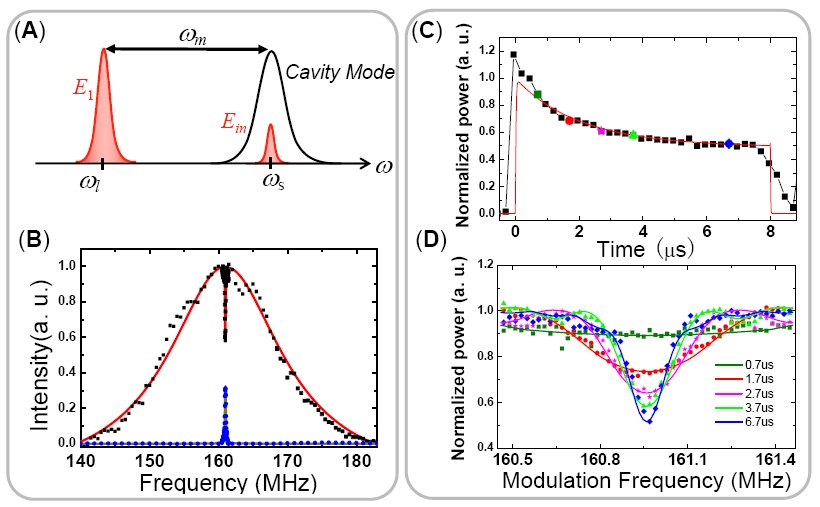
Fig. 8. (A) Schematic of an optomechanical resonator. (B) Spectral response of OMIT (top trace) and light storage (bottom trace). The spectral response near the anti-Stokes resonance, with an expanded frequency scale. Squares in the top trace are the signal power emitted from the microsphere. Circles in the bottom trace are the power of the retrieved pulse emitted from the microsphere. Both are obtained as a function of the detuning between the signal field and the control field, which is fixed at the red sideband. (C) Emission power from the WGM as a function of the timing of the detection gate, obtained with the signal pulse at theWGM resonance. (D) Emission power from the WGM as a function of the detuning between the signal and control, obtained at various timings for the detection gate as indicated in the figure. Different symbols are also used to indicate the timing of the detection gate. Personal Information
| |

